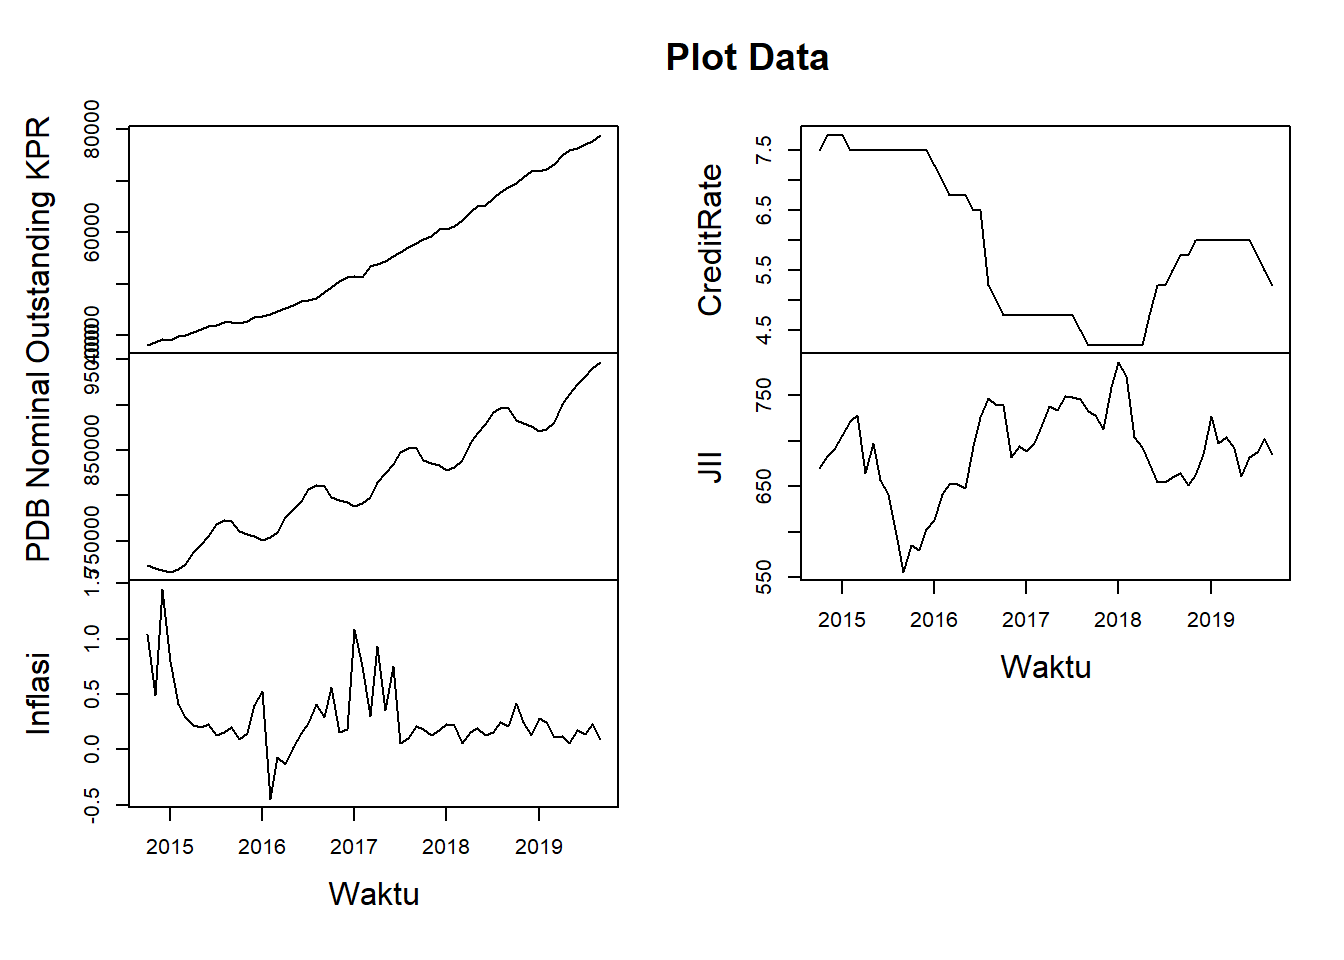
 Outstanding KPR  PDB Nominal        Inflasi          CreditRate
 Min.   :38047   Min.   :715580   Min.   :-0.4500   Min.   :4.250
 1st Qu.:43622   1st Qu.:766385   1st Qu.: 0.1300   1st Qu.:4.750
 Median :53612   Median :812954   Median : 0.2050   Median :5.875
 Mean   :55303   Mean   :818266   Mean   : 0.2838   Mean   :5.896
 3rd Qu.:65595   3rd Qu.:871216   3rd Qu.: 0.3125   3rd Qu.:7.312
 Max.   :78998   Max.   :947281   Max.   : 1.4500   Max.   :7.750
      JII
 Min.   :556.1
 1st Qu.:659.2
 Median :691.5
 Mean   :688.1
 3rd Qu.:726.7
 Max.   :787.1