The ahp.cr function calculates the consistency ratio of each decision-maker, defined by the following equation:
CR = (λ − n)/((n − 1)(RI))
Where λ is the maximum eigenvalue of the pairwise comparison matrix, n is the number of attributes, and RI is the random index. Following Saaty and Tran (2007), the RI is a function of n and is the consistency ratio of randomly generated pairwise comparison matrices.
Saaty showed that when the CR is higher than 0.1, the choice is deemed to be inconsistent
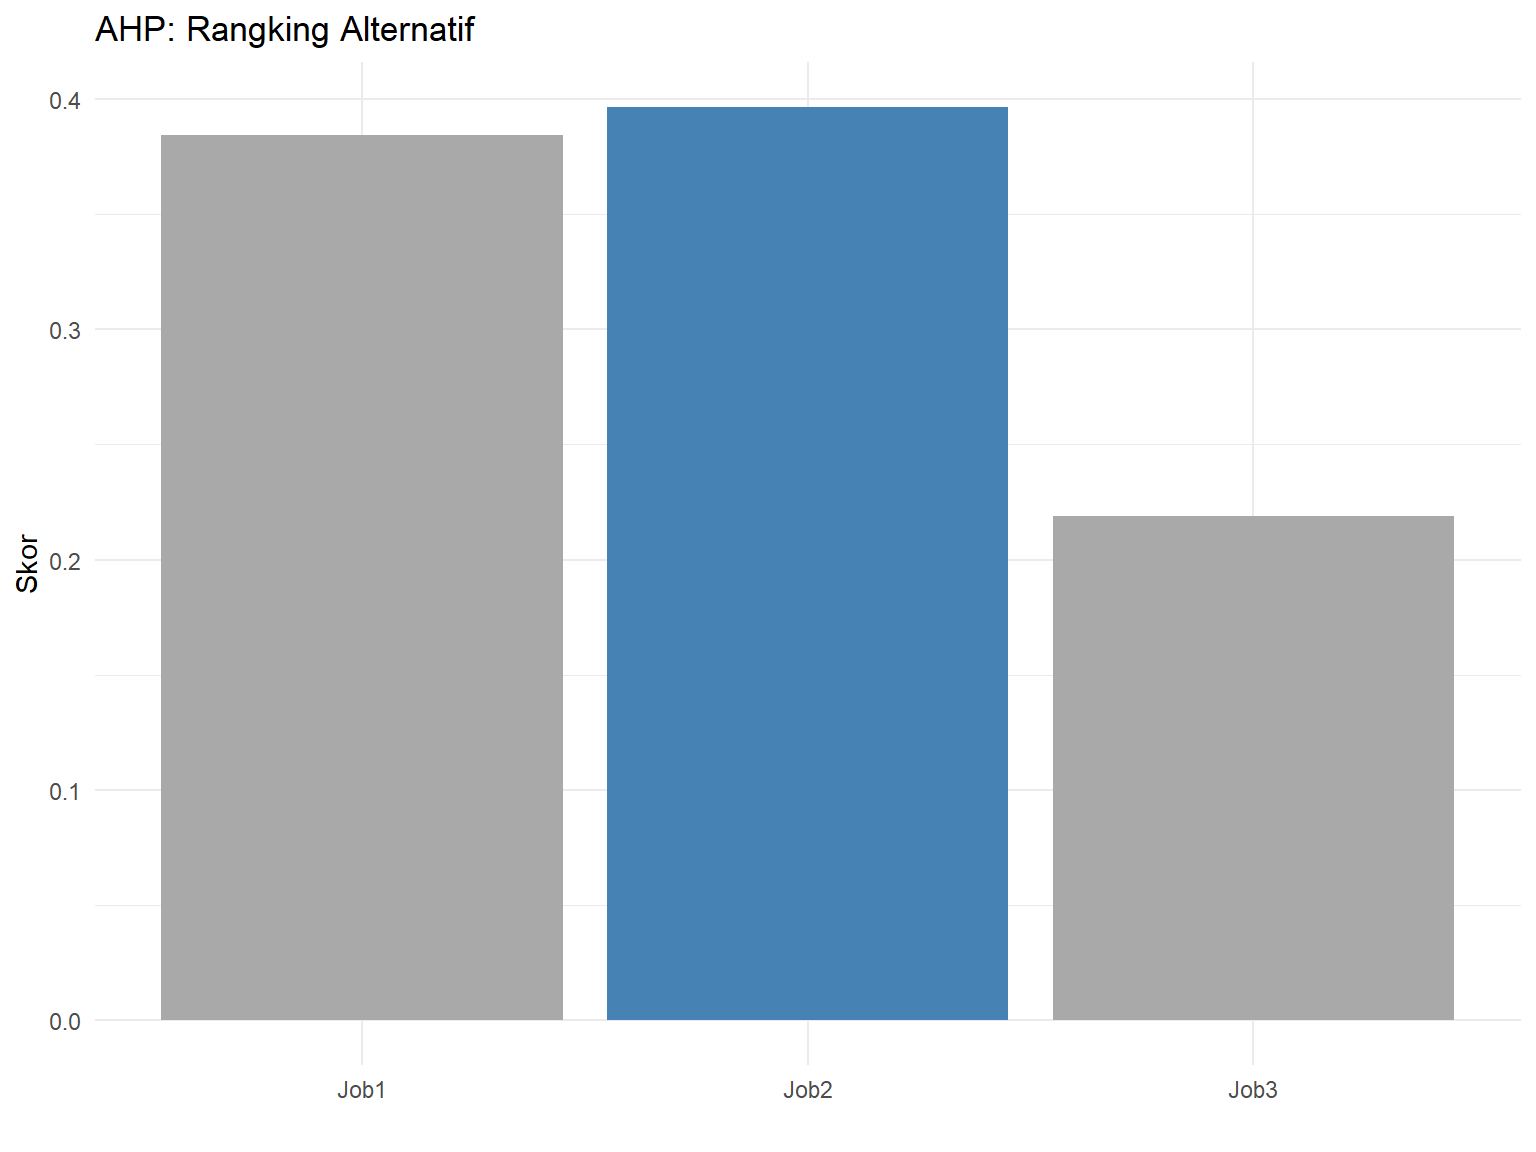
data =data.frame("Cat"=row.names(data.frame(alternatif_agg)),data.frame(alternatif_agg))data$Cat <-factor(data$Cat, levels =c( "J1" , "J2" ,"J3"),labels =c("Job1", "Job2","Job3"))# Buat grafik batangdata$warna <-ifelse(data$alternatif_agg ==max(data$alternatif_agg), "terbesar", "lainnya")# Buat grafik batangggplot(data, aes(x = Cat, y = alternatif_agg, fill = warna)) +geom_bar(stat ="identity") +scale_fill_manual(values =c("terbesar"="#4682B4", "lainnya"="#A9A9A9")) +theme_minimal() +theme(legend.position ="none") +labs(title ="AHP: Rangking Alternatif",y ="Skor",x ="")
Source Code
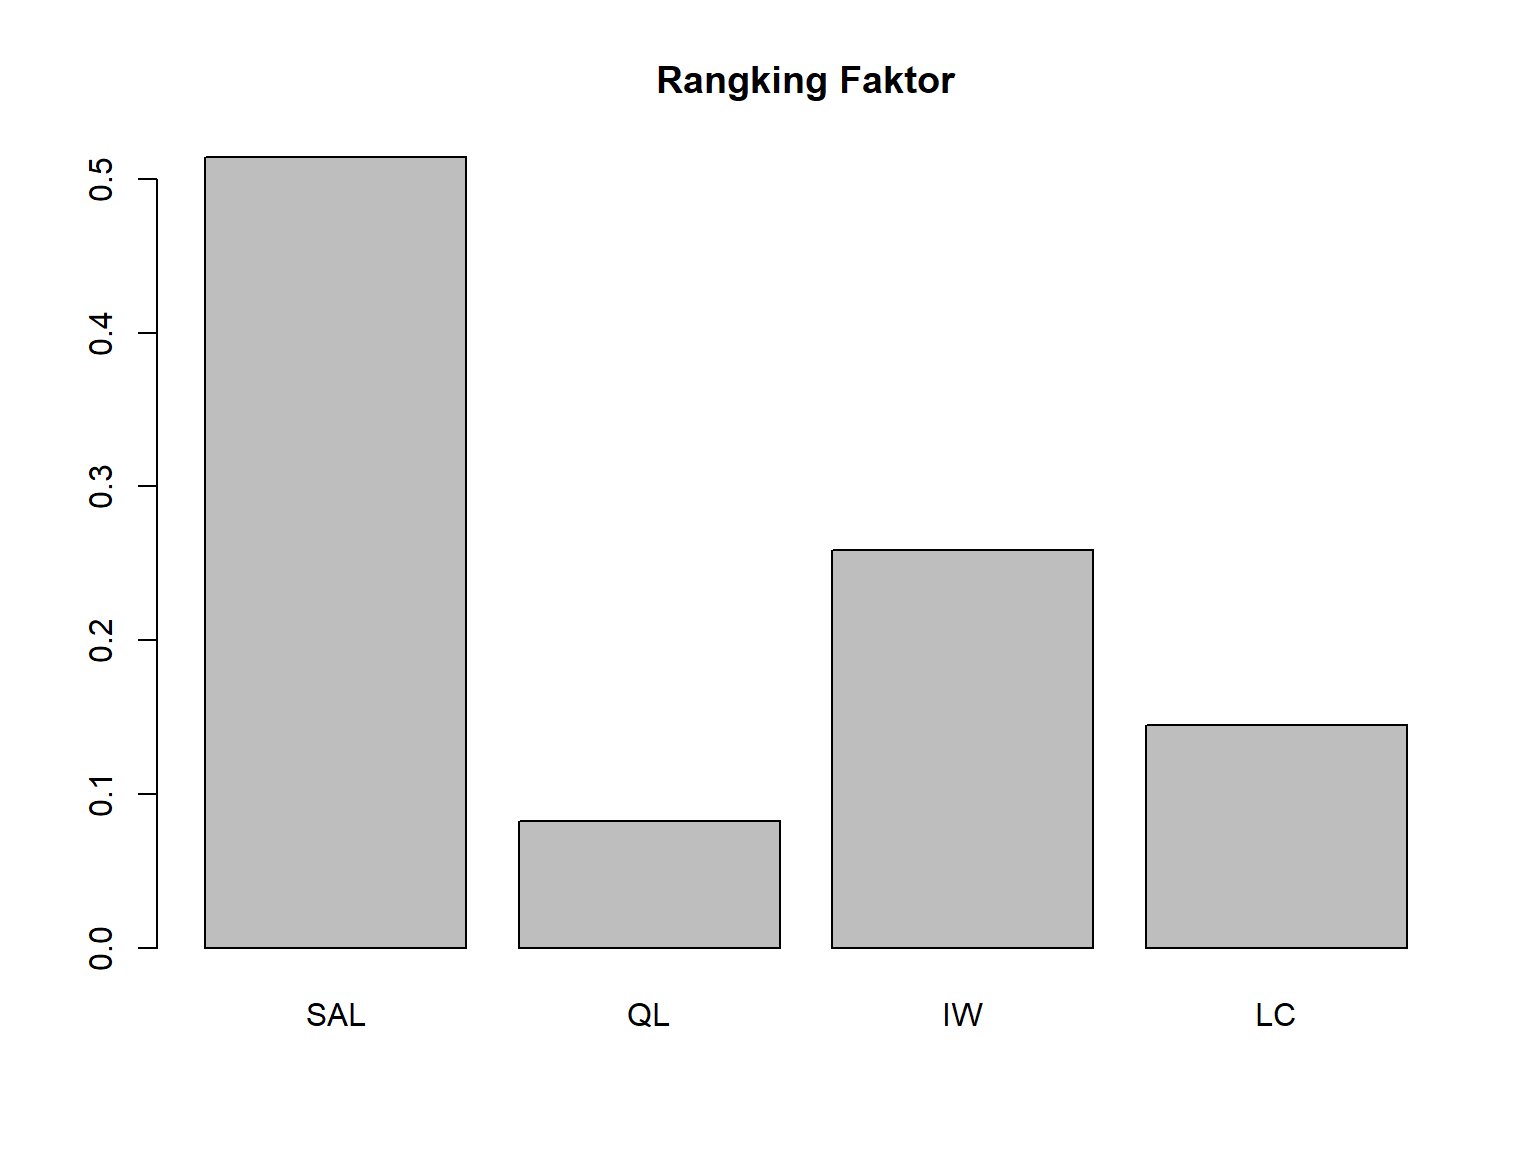
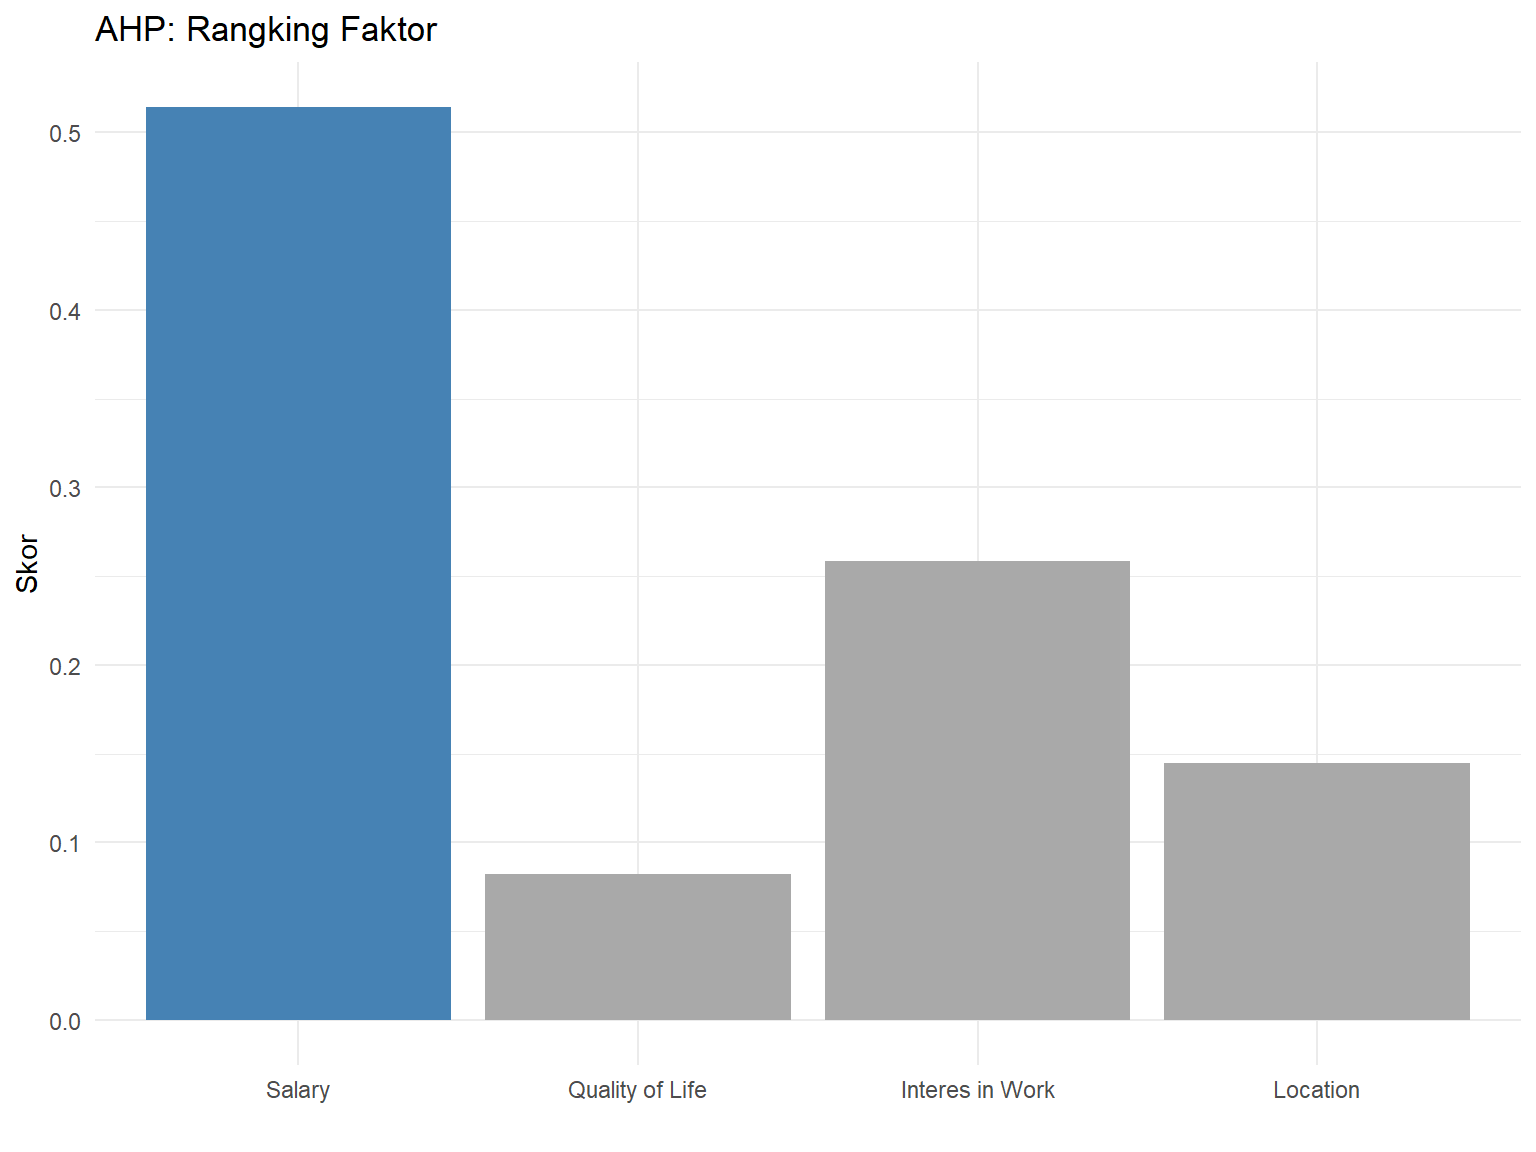
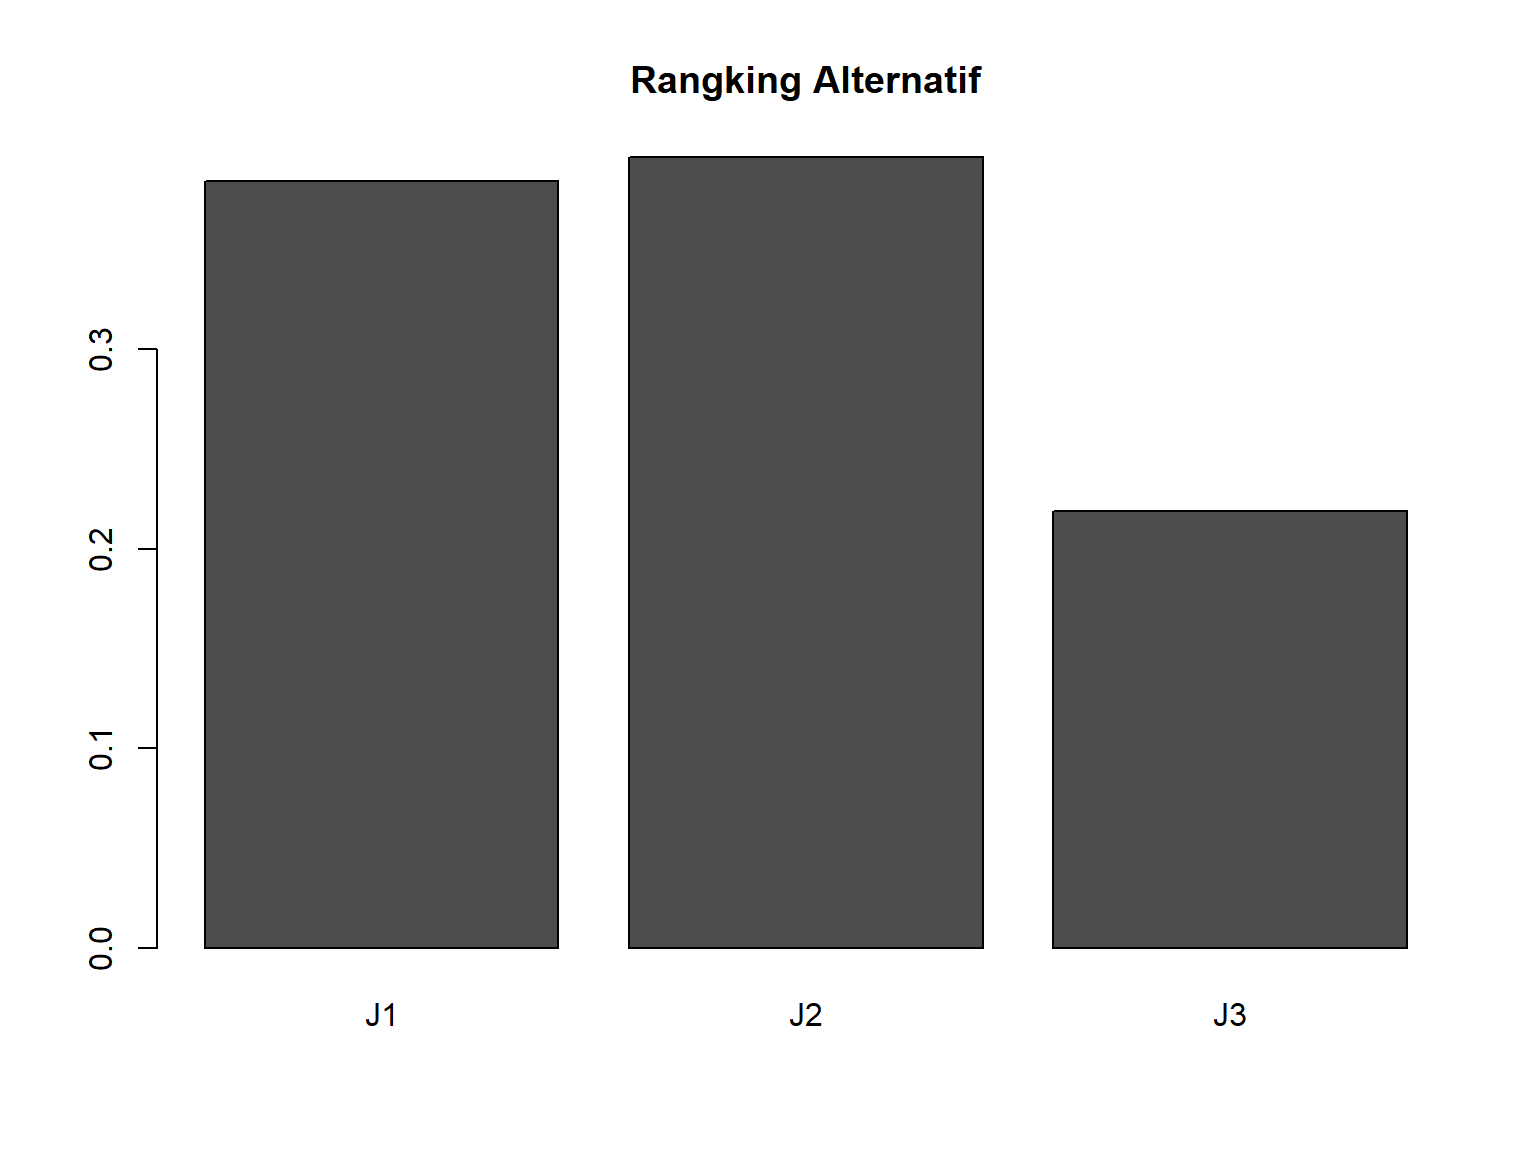
# Analytic Hierarchy Process (AHP)## Prosedur Pengolahan AHP### Data```{r}ahpdata <-read.csv("Data/ahp.csv")ahpdata```### Analisis#### Faktor```{r}# Mendefinisikan faktorfaktor <-c("SAL", "QL", "IW", "LC")# Menampilkan data framefaktor_data <- ahpdata[, 2:7]faktor_data``````{r}# install.packages("ahpsurvey")library(ahpsurvey)faktor_data_mat <-ahp.mat(df = faktor_data, faktor, negconvert =TRUE)faktor_data_mat``````{r}# Consistencyri <-ahp.ri(nsims =10000, dim =4, seed =42)ahp.cr(faktor_data_mat, faktor, ri)``````{r}#Treatement Consistency (Jika Tidak Konsisten)#faktor_data_mat <- ahp.harker(faktor_data_mat, faktor, iterations = 10, stopcr = 0.1)#ahp.cr(faktor_data_mat, faktor)```The ahp.cr function calculates the consistency ratio of each decision-maker, defined by the following equation:CR = (λ − n)/((n − 1)(RI))Where λ is the maximum eigenvalue of the pairwise comparison matrix, n is the number of attributes, and RI is the random index. Following Saaty and Tran (2007), the RI is a function of n and is the consistency ratio of randomly generated pairwise comparison matrices.Saaty showed that when the CR is higher than 0.1, the choice is deemed to be inconsistent#### Individual Rangking Faktor```{r}library(tidyverse)library(tibble)faktor_ind <-ahp.indpref(faktor_data_mat, faktor, method ="arithmetic")round(faktor_ind, 3) %>%rownames_to_column('ID')```#### Aggregate Rangking Faktor```{r}faktor_agg <-ahp.aggpref(faktor_data_mat, faktor, method ="arithmetic", aggmethod ="arithmetic")round(faktor_agg, 3) %>%t()``````{r}barplot(faktor_agg,main="Rangking Faktor")``````{r}library(ggplot2)# Mengubah Cat menjadi factor dengan label yang diinginkandata =data.frame("Cat"=row.names(data.frame(faktor_agg)),data.frame(faktor_agg))data$Cat <-factor(data$Cat, levels =c("SAL", "QL", "IW", "LC"),labels =c("Salary", "Quality of Life", "Interes in Work", "Location"))# Mengurutkandata$warna <-ifelse(data$faktor_agg ==max(data$faktor_agg), "terbesar", "lainnya")# Buat grafik batangggplot(data, aes(x = Cat, y = faktor_agg, fill = warna)) +geom_bar(stat ="identity") +scale_fill_manual(values =c("terbesar"="#4682B4", "lainnya"="#A9A9A9")) +theme_minimal() +theme(legend.position ="none") +# Sembunyikan legendalabs(title ="AHP: Rangking Faktor",y ="Skor",x ="")```#### Alternatif#### Alternatif untuk Faktor Salary```{r}library(dplyr)alternatif <-c("J1", "J2", "J3")# Menampilkan data framealternatif_data1 <- ahpdata[,8:10]alternatif1 <-ahp.mat(df = alternatif_data1, atts = alternatif, negconvert =TRUE)alternatif1_agg <-ahp.aggpref(alternatif1, alternatif, method ="arithmetic", aggmethod ="arithmetic")round(alternatif1_agg, 3) %>%t()``````{r}#Consistencyri <-ahp.ri(nsims =10000, dim =3, seed =42)ahp.cr(alternatif1, alternatif, ri)```#### Alternatif untuk Faktor Quality of Life```{r}alternatif_data2 <- ahpdata[,11:13]alternatif2 <-ahp.mat(df = alternatif_data2, atts = alternatif, negconvert =TRUE)alternatif2_agg <-ahp.aggpref(alternatif2, alternatif, method ="arithmetic", aggmethod ="arithmetic")round(alternatif2_agg, 3) %>%t()``````{r}#Consistencyahp.cr(alternatif2, alternatif, ri)```#### Alternatif untuk Faktor Interest in Work```{r}alternatif_data3 <- ahpdata[,14:16]alternatif3 <-ahp.mat(df = alternatif_data3, atts = alternatif, negconvert =TRUE)alternatif3_agg <-ahp.aggpref(alternatif3, alternatif, method ="arithmetic", aggmethod ="arithmetic")round(alternatif3_agg, 3) %>%t()``````{r}#Consistencyahp.cr(alternatif3, alternatif, ri)```#### Alternatif untuk Faktor Location```{r}alternatif_data4 <- ahpdata[,17:19]alternatif4 <-ahp.mat(df = alternatif_data4, atts = alternatif, negconvert =TRUE)alternatif4_agg <-ahp.aggpref(alternatif4, alternatif, method ="arithmetic", aggmethod ="arithmetic")round(alternatif4_agg, 3) %>%t()``````{r}#Consistencyahp.cr(alternatif4, alternatif, ri)```#### Gabungan Alternatif```{r}alternatif_agg <-cbind(alternatif1_agg,alternatif2_agg, alternatif3_agg,alternatif4_agg) %*% faktor_aggalternatif_agg``````{r}barplot(t(alternatif_agg) ,main="Rangking Alternatif")``````{r}data =data.frame("Cat"=row.names(data.frame(alternatif_agg)),data.frame(alternatif_agg))data$Cat <-factor(data$Cat, levels =c( "J1" , "J2" ,"J3"),labels =c("Job1", "Job2","Job3"))# Buat grafik batangdata$warna <-ifelse(data$alternatif_agg ==max(data$alternatif_agg), "terbesar", "lainnya")# Buat grafik batangggplot(data, aes(x = Cat, y = alternatif_agg, fill = warna)) +geom_bar(stat ="identity") +scale_fill_manual(values =c("terbesar"="#4682B4", "lainnya"="#A9A9A9")) +theme_minimal() +theme(legend.position ="none") +labs(title ="AHP: Rangking Alternatif",y ="Skor",x ="")```